Services:
Catalogues
ACVS / variables
AASC / photometry
Sky Atlas
Kepler FOV
Download Data
View Alerts
Star of the Month
Information:
Credit
Status
Papers
History
Visitors so far: 354147.
Services:
Catalogues
ACVS / variables
AASC / photometry
Sky Atlas
Kepler FOV
Download Data
View Alerts
Star of the Month
Information:
Credit
Status
Papers
History
Visitors so far: 354147.
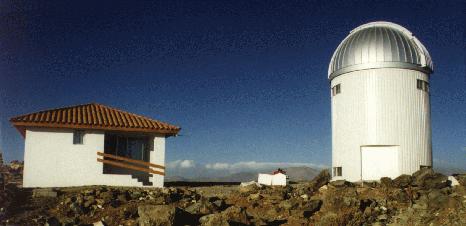
The prototype
camera system was succesfully shipped to Las Campanas Observatory
on March 15, and was assembled and tested on April 3-6. The first light on LCO
was obtained on April 4, and the first almost routine observations were started
on April 7. Since than the prototype camera was taking data in the supervised
mode on each of the next 18 nights.
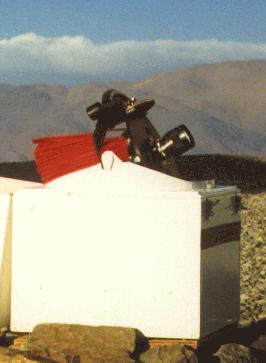
The prototype was left on Las Campanas running and now takes
data on each clear night in the fully automated mode.
The prototype is located near the Polish 1.3 m telescope and
resident astronomers from the OGLE team took care about closing the
instrument in case of rain or snow.
Field Name    R.A.     DEC

    NVEL1999   10:44:49  -52:25:35
   GRB980923    5:07:48  -80:36:00
       LMC_1    5:10:00  -68:10:00
       LMC_2    5:10:00  -70:00:00
       LMC_3    5:40:00  -68:10:00
       LMC_4    5:40:00  -70:00:00
 Centaurus_1   11:35:00  -60:00:00
 Centaurus_2   11:35:00  -61:50:00
 Centaurus_3   11:35:00  -63:40:00
    Octans_1   12:00:00  -85:00:00
       Virgo   12:30:00    3:00:00
   Coal_Sack   12:50:00  -63:00:00
  PG1323-086   13:25:00   -8:50:50
 Centaurus_4   13:50:00  -30:00:00
 Centaurus_5   13:50:00  -31:50:00
       Libra   15:05:00  -15:00:00
 Sagittari_1   17:00:00  -22:30:00
     Scorpio   17:55:00  -35:00:00
 Sagittari_2   18:00:00  -23:30:00
 Sagittari_3   19:00:00  -22:30:00
    Corona_A   19:00:00  -40:00:00
 Sagittari_4   20:00:00  -20:30:00
 Capricorn_1   21:00:00  -17:00:00
 Capricorn_2   22:00:00  -12:00:00
    Aquarius   23:00:00   -6:30:00
      Pisces    0:00:00    0:00:00
       S-092    0:55:00    1:00:00
       S-093    1:55:00    0:45:00
       S-094    2:56:00    0:30:00
       S-095    3:53:00    0:00:00
       S-096    4:52:00    0:00:00
       S-097    5:57:00    0:00:00
       S-098    6:51:00   -0:20:00
       S-099    7:56:00   -0:20:00
       S-100    8:53:00   -0:40:00
       S-101    9:57:00   -0:30:00
       S-102   10:57:00   -0:20:00
       S-103   11:56:00   -0:30:00
       S-104   12:43:00   -0:30:00
       S-105   13:37:00   -0:20:00
       S-106   14:40:00   -0:10:00
       S-107   15:40:00   -0:20:00
       S-108   16:37:00    0:20:00
       S-109   17:45:00    0:00:00
       S-110   18:41:00    0:10:00
       S-111   19:38:00    0:10:00
       S-112   20:42:30    0:10:00
       S-113   21:41:00   -0:20:00
       S-114   22:40:00    1:00:00
       S-115   23:40:00    1:00:00
Standard dark frame subtraction and flatfielding was automaticaly done for each frame. Than the customized software for the object detection, classification and aperture photometry was run on each frame. We did not used profile photometry because of the current problems with the PSF shape. Star density varies between 1000 and 8000 stars per frame, at about 4-sigma detection thresold. Aperture photometry seems to be acurrate (in the crowded field) to within 0.01 mag for the brightest (not yet saturated) stars.
 Presented data show Centaurus_1 Region, crowded field in the Milky Way.
Current data set covers 8 nights (April 7-14) and consists of over 80 images.
Each frame contains more than 6000 stars above 4-sigma thresold. There are few
saturated stars as well as few bright unresolved blends in the image. The
brightest star (1/5 from bottom 4/10 from left) is SAO....
Presented data show Centaurus_1 Region, crowded field in the Milky Way.
Current data set covers 8 nights (April 7-14) and consists of over 80 images.
Each frame contains more than 6000 stars above 4-sigma thresold. There are few
saturated stars as well as few bright unresolved blends in the image. The
brightest star (1/5 from bottom 4/10 from left) is SAO....
 The following magnitude vs. magnitude dispersion diagram presents
intrinsic variation of the stars' aperture photometry as a function of the
star brightness. Solid line delimiters "variable candidates"; their
corresponding "light variation" curves are shown below.
The following magnitude vs. magnitude dispersion diagram presents
intrinsic variation of the stars' aperture photometry as a function of the
star brightness. Solid line delimiters "variable candidates"; their
corresponding "light variation" curves are shown below.
 Picture on the left shows "constant stars" - for which star brightness disspersion
is smaller than average:
Picture on the left shows "constant stars" - for which star brightness disspersion
is smaller than average:
 This picture shows "variable stars" - for which star brightness disspersion
is much larger than average (it is obvious, that for a while many "variables"
are due to individual outstanding points, probably missidentifications):
Stars brighter than magnitude 7 are may contain saturated pixels and therefore
their magnitudes are only approximate.
This picture shows "variable stars" - for which star brightness disspersion
is much larger than average (it is obvious, that for a while many "variables"
are due to individual outstanding points, probably missidentifications):
Stars brighter than magnitude 7 are may contain saturated pixels and therefore
their magnitudes are only approximate.