
| This is the official discovery website for: |
|
|
| Abstract: We report the discovery of a six-month-long mid-infrared transient, SDWFS-MT-1 (SN 2007va), in the Spitzer Deep, Wide-Field Survey of the NOAO Deep Wide-Field Survey Bootes field. The transient, located in a z=0.19 low luminosity (M_[4.5]~-18.6 mag, L/L_MilkyWay~0.01) metal-poor (12+log(O/H)~7.8) irregular galaxy, peaked at a mid-infrared absolute magnitude of M_[4.5]~-24.2 in the 4.5 micron Spitzer/IRAC band and emitted a total energy of at least 10^51 ergs. The optical emission was likely fainter than the mid-infrared, although our constraints on the optical emission are poor because the transient peaked when the source was "behind" the Sun. The Spitzer data are consistent with emission by a modified black body with a temperature of ~1350 K. We rule out a number of scenarios for the origin of the transient such as a Galactic star, AGN activity, GRB, tidal disruption of a star by a black hole and gravitational lensing. The most plausible scenario is a supernova exploding inside a massive, optically thick circumstellar medium, composed of multiple shells of previously ejected material. If the proposed scenario is correct, then a significant fraction (~10%) of the most luminous supernova may be self-enshrouded by dust not only before but also after the supernova occurs. The spectral energy distribution of the progenitor of such a supernova would be a slightly cooler version of eta Carina, peaking at 20-30 microns. |
| Spitzer Data: SDWFS-MT-1, where MT means mid-IR transient as a parallel notation to using OT for optical transient, is the most significantly variable source in the entire SDWFS field. It corresponds to the SDWFS source SDWFS J142623.24+353529.1. The [3.6] and [4.5] light curves were strongly correlated (r=1) and the variability amplitude was 76 standard deviations from the mean for its average magnitude. A detailed definition of these variability criteria is given in Kozlowski et al. (2010). The SDWFS survey consists of four epochs, taken 3.5 years, 6 months, and 1 month apart. The object is not detected in any of the four IRAC bands in the first epoch (also known as the IRAC Shallow Survey, Eisenhardt et al. 2004) on 2004 January 10-14 (JD'=JD-2450000=3016.5). The SDWFS single epoch 3 sigma detection limits of [3.6]=19.67 mag, [4.5]=18.73 mag, [5.8]=16.33 mag, and [8.0]=15.67 mag (4 arcsec apertures corrected to 24 arcsec; Vega mag), set our upper limits on the object brightness in the first epoch. The observed part of the transient peaked in the second epoch taken 2007 August 8-13 (JD'=4322.5) at [3.6]=15.93 mag and [4.5]=15.61 mag. It was slightly fainter 6 months later in epoch 3 (2008 February 2-6, JD'=4500.5), with [3.6]=16.09 mag and [4.5]=15.76 mag. Then, in a matter of a month, the object faded by almost 2 magnitudes to [3.6]=17.99 mag and [4.5]=17.72 mag in epoch 4 on 2008 March 6-10 (JD'=4533.5). We present all the available data in the discovery paper by Kozlowski et al. (2010). |
| Short Transient Description: A model that explains the transient best is a self-obscured supernova, that has two concentric (patchy) shells, each with the mass of ~10 M_Sun, ejected prior to the SN explosion. The inner shell at ~300 AU protects the dust in the outer shell from initial luminosity spikes and converts the high kinetic energy of the SN shock wave into thermalized radiation with T~10000 K. The dust in the more distant (0.05 pc) second shell absorbs the radiation of the first shell, and reradiates it at T~1000 K, while simultaneously smoothing out and stretching the light curve. This scenario matches the observed energy, luminosity, time and temperature scales of the transient by slightly modifying the scenarios used for other hyper-luminous Type IIn SN (e.g., Smith et al. 2008a,b; Miller et al. 2010b). The host galaxy of the transient is also typical of these SN, and our estimate of the rate is consistent with such events being ~10% of hyper-luminous Type II SNe. |
| |
|
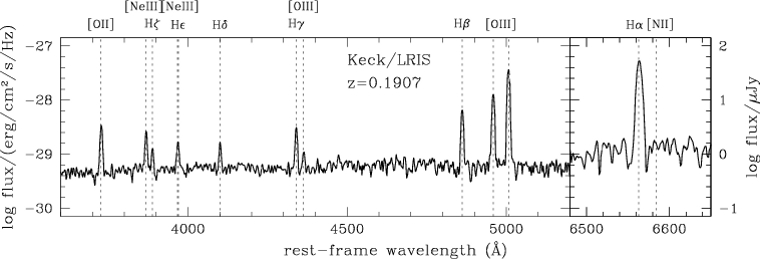
The Keck/LRIS rest-frame spectrum (blue part) of the transient's host galaxy, taken two years after the event, with
the major emission lines marked.
The redshift of the host galaxy is z=0.1907, so the luminosity distance is 920 Mpc, the distance modulus is 39.82 mag, and the angular scale is 3.15 kpc/arcsec. Before measuring the line fluxes, we corrected the host galaxy spectrum for the Galactic extinction (E(B-V)=0.014 mag) using Schlegel et al. (1998). We do not detect the [NII] 6584A line, which implies log([NII]/Halpha)<-1.5. Combining it with log([OIII] 5007A/Hbeta)=0.78, we conclude that the host is an irregular HII galaxy (see e.g., Terlevich et al. 1991; Kniazev et al. 2004). The lack of [NII] and [NeV] 3426A lines and the clear detection of the 4363A line rule out the presence of an AGN in the host galaxy. To derive the metallicity, we measured the fluxes of the [OII] 3727A, [OIII] 4363A, [OIII] 4959A, [OIII] 5007A and Hbeta 4861A lines. We followed the prescription of Pilyugin & Thuan (2007) to derive the gas-phase oxygen abundance of the host of 12+log(O/H)=7.85+/-0.13. We assumed an electron density of ne=100 cm^3 , but the value does not change significantly with changes in the electron density (e.g., 12+log(O/H)=7.87 if we use ne=1000 cm^3 instead). Next, we verified this metallicity measurement using the prescriptions of Izotov et al. (2006) to get 12+log(O/H)=7.79. As a cross check, we also used the oxygen-to-hydrogen flux ratio R23=([OII]+[OIII])/Hbeta=(F3727+F4959+F5007)/F4861 method of Pagel et al. (1979) and Pettini & Pagel (2004) O3N2 method to derive oxygen abundances. The clear detection of the 4363A line and log([NII]/Halpha)<-1.5 strongly suggests that we should use the "lower" metallicity branch in the R23 method. We use the relations from Skillman (1989) and Yin et al. (2007) with our measured log(R23)=0.94, to get the oxygen abundances of 12+log(O/H)=7.78 and 7.80, respectively. The O3N2 method gives 12+log(O/H)<8.0. All these estimates are approximately 10% of the solar value (assuming 8.8 from e.g., Delahaye et al. 2010). |
|
| |
| Spectral Energy Distribution (SED) of SN 2007va during the second epoch of SDWFS. We fit a modified black body SED that includes the dust emissivity (Q~1/lambda) to the four IRAC bands (filled circles) and find a best fitting temperature of T=1357+/-57 K (dotted line). We also show a template SED for the host galaxy modeled as an irregular (dashed line; Assef et al. 2010) and the combination of the modified black body and irregular galaxy SEDs (thick solid line). Overplotted are the V, R and IRAC filter transmission curves, "normalized" to 5x10^41 erg/s. The MDM (QUEST) limit is derived for an observation taken 90 (~40) days prior to the second epoch of SDWFS. The CRTS limit corresponds to the stack of 3 epochs (12x30 sec images) taken between SDWFS epochs 3 and 4. The open squares mark the NDWFS B_W, R, and I-band measurements for the host galaxy (from left to right). |
| |
|
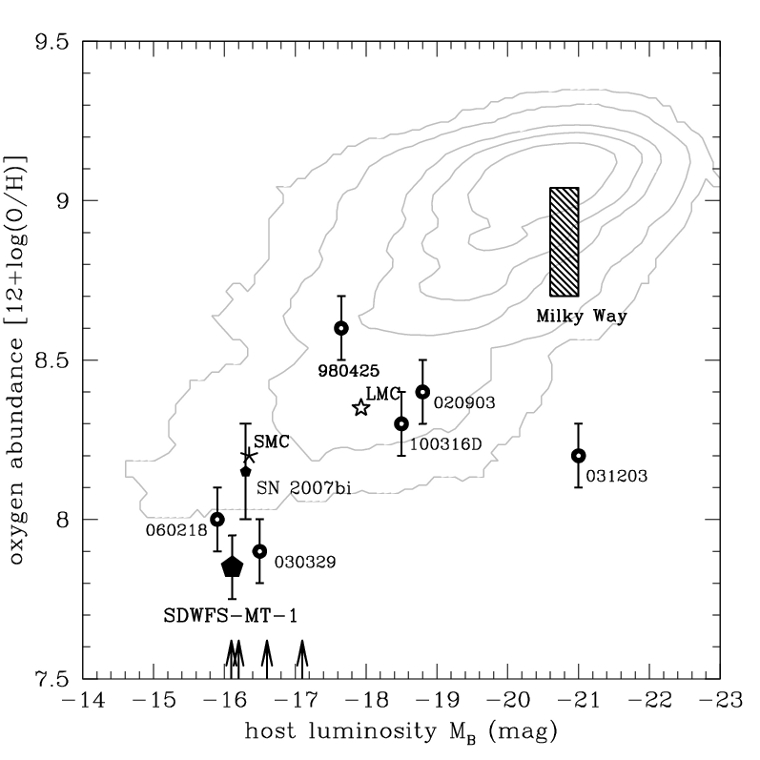
Metallicity-luminosity relation for 125,958 SDSS DR4 star forming galaxies (e.g,
Tremonti et al. 2004; Prieto et al. 2008). They are binned into 0.1 mag and 0.025 dex bins
and the smoothed contours (3x3 bins) are drawn for 1, 10, 50, 100 and 200 objects per
bin, counting from the outer contour. The figure is analogous to Figure 1 from Stanek et al.
(2006). SDWFS-MT-1 is shown as the filled pentagon (lower left). A handful of local
GRBs with associated SNe (and two SNe) with known hosts metallicities and luminosities
(small pentagons). The arrows show M_B for five host galaxies
of high luminosity SN with unknown oxygen abundances. They are, from left to right, SN
2005ap, SN 2006tf, SN 2008fz, SN 2008es, and SN 2006gy.
The general message of the above plot is clear: GRBs and luminous SNe prefer low metallicity, low luminosity
galaxies, so does SDWFS-MT-1.
The LMC/SMC oxygen abundances are adopted following Peeples et al. (2008) and Milky Way's (solar) are from Delahaye et al. (2010), while the absolute magnitudes are from Karachentsev (2005). |
Contributors:
|
Participating Institutions:
|
Related Publications:
Terms of use of the data/plots: Please feel free to use any of the above pictures in your talk/presentation/poster. If you like our discovery please cite it approprietly in your own work (papers, etc.). Thanks! |
| Last modification: August 2nd, 2010 |